Filtering for Soft Protons
SAS Version: 19.0.0
(Remember to set your browser Tex-Encoding as unicode if some characters in this page is not probably displayed.)
This chapter is the very first step. We will create event lists (mos1S001-clean.fits, mos2S002-clean.fits, pnS003-clean.fits and pnS003-clean-oot.fits) which extract the events satisfying certain criteria from the odf. When you run any esas command, the terminal shows up a lot of stuff which tells what subcommand is executed, and whether it is suceessfully executed or not. To make it easy to check in case there is a problem, we put all the output in the terminal in the log folder.
To beign with, set the odf path, then run the first step:
setenv SAS_ODF path_to_odf
cifbuild >& log/cifbuild.log
ccf.cif is produced. You can open it using fv to take a look. It is a table. Now we have to set the ccf path. If you don't set it, sometimes a command cannot be executed.
setenv SAS_CCF ccf.cif
Then run odfingest:
odfingest >& log/odfingest.log
2849_0762870601_SCX00000SUM.SAS is produced. It is a text file which contains obervation summary. Now we set the path or other commands cannot be executed, then go on with the rest:
setenv SAS_ODF `ls -1 2849_0762870601_SCX00000SUM.SAS`
epchain >& log/epchain.log
epchain withoutoftime=true >& log/epchainoot.log
emchain >& log/emchain.log
epchain and emchain produce an unfiltered event lists, namely mos1S001-ori.fits, mos2S002-ori.fits,pnS003-oot.fits and pnS003-ori.fits. They will be used for further filtering to exclude soft protons.
pn-filter >& log/pn-filter.log
mos-filter >& log/mos-filter.log
pn-filter and mos-filter use the unfiltered event lists produced from the previous step to create the final clean event list – mos1S001-clean.fits, mos2S002-clean.fits, pnS003-clean.fits and pnS003-clean-oot.fits. These files will be used for all subsequent analysis. For mos1 and mos2, mos-filter also checks for anomalies of each ccd chip, i.e. ccd 2 to ccd 7, by comparing the lightcuves in high and low energies extracted from the corner, which does not contain any events from the FOV (hence, any anomalies would mean intrinsic). Some ccd chips have high counts and they have to be excluded from analysis, but their events are still in mos1S001-clean.fits and mos2S002-clean.fits. What ccd chips are anomalous is written in the file command.csh, after you have run mos-filter. I will show you how this file is produced in the next chapter Anomalous CCD Check.
Now let's check the products after filter. There is a diagnostic plot called mos1S001-hist.qdp. Let's open it:
qdp mos1S001-hist.qdp
PGPLOT file/type:
/xw
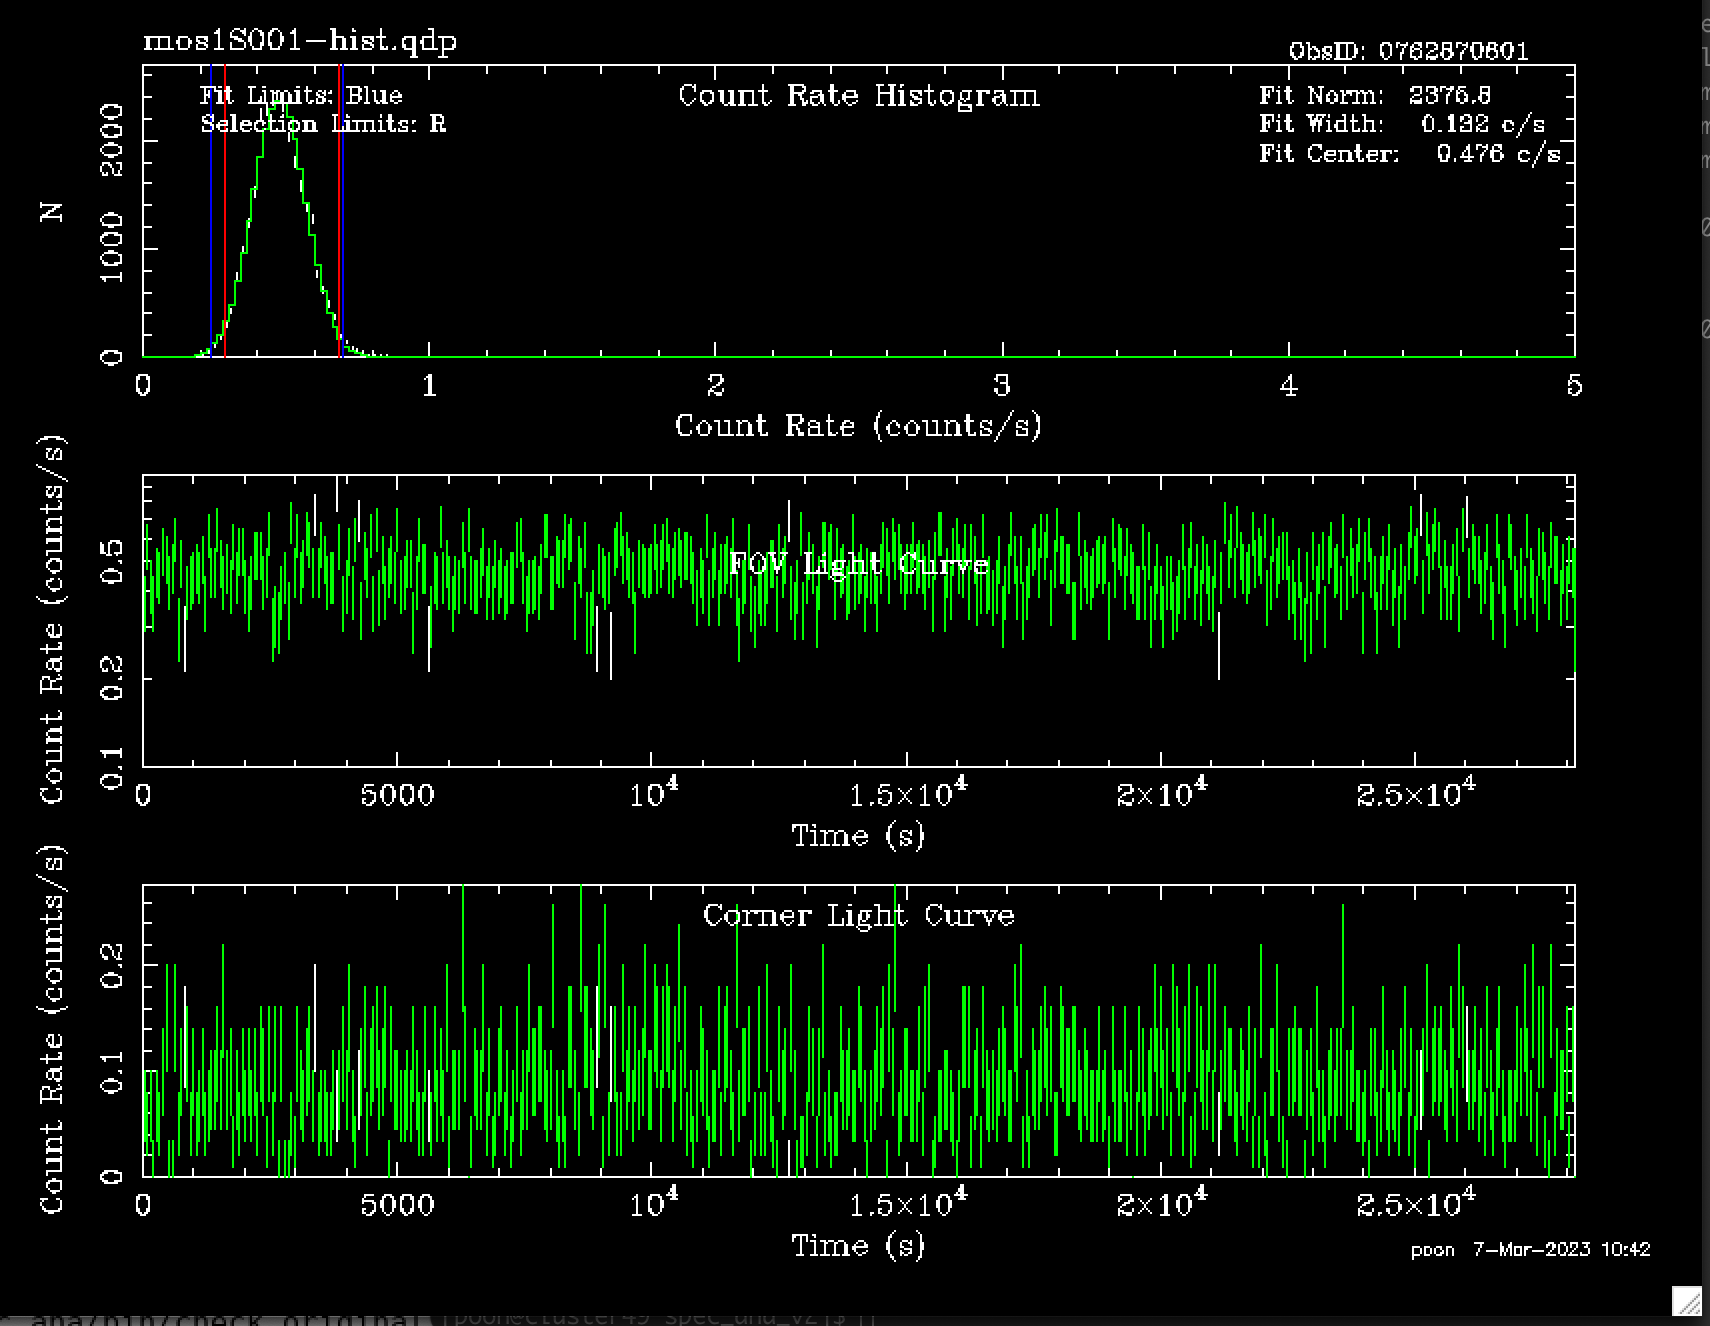
It looks like this:
Fig.1 mos1S001-hist.qdp – a plot showing the extracted events in mos1S001-clean.fits.
Also, you see mos1S001-gti.txt. It is the file containing the good time interval, i.e. events within the red boundary in the first panel of Fig.1. This file is used to extract the clean event list (mos1S001-clean.fits) from the raw event list (mos1S001-ori.fits) . Open it and take a look:
cat mos1S001-git.txt
552003584.76082599
552004364.76082599
+
552004424.76082599
552006944.76082599
+
552007004.76082599
552007364.76082599
+
552007424.76082599
552007784.76082599
+
552007844.76082599
552009164.76082599
+
552009224.76082599
552012464.76082599
+
552012524.76082599
552012764.76082599
+
552012824.76082599
552016244.76082599
+
552016304.76082599
552024704.76082599
+
552024764.76082599
552028664.76082599
+
552028724.76082599
552029564.76082599
+
552029624.76082599
552031737.76082599
+
Of course finally, you have the most important final product – mos1S001-clean.fits, which contain both FOV and corner events.
Here is the physical idea of the above processes.
1)
Create lightcurves in a certain energy range, i.e. 2.5-12 keV (used by ESAS or a range of your choice) using mos1S001-ori.fits (the event list which contain all unfiltered events). Energies > 2.5 keV well avoid cosmic X-ray background and solar wind contaminations. After 7 keV, the cluster emission is small, so high count rates are likely due to soft proton flares. The lightcurves are in units of count rates per second.
2)
Bin the lightcurves, the default is 60s.
3)
Plot a histogram to see the distribution of count rates per second, then make a gaussian fit.
4)
Set criteria for filter, e.g. within 2σ of the best fit. A text file and a fits file containing the good time interval fulfilling the selection criteria is written in mos1S001-gti.txt and mos1S001-gti.fits
5)
Use the good time interval file (mos1S001-gti.fits) to write the final product for all analysis - mos1S001-clean.fits.
Now you run the following command to do the physical process yourself using python. Feel free to change the default parameters in the code like energy range(elow,ehigh), binszie, fit_limit or sig. Note that this program does not work for pn since oot is not corrected for.
python3 src/filter_sp_script.py mos1S001 #or mos2S002
If you run it successfully, you see the following in the terminal.
mos1S001-LC-2.5-12.0.fits is produdced
mos1S001-LC-corn-2.5-12.0.fits is produdced
The good time interval file, mos1S001_gti_ED.txt, is produced
mos1S001_gti_ED.fits is produced
mos1S001-clean_ED.fits is produced
I am now breaking down each step. This input file for this program is mos1S001-ori.fits, the unfiltered event list.
1.Lightcuves in the energy range [2.5 – 12] keV are produced for the FOV and corner, namely mos1S001-LC-2.5-12.0.fits and mos1S001-LC-corn-2.5-12.0.fits, using the following commands.
FOV
evselect table=mos1S001-ori.fits expression='(PATTERN<=12)&&(PI in [2500:12000])&&((FLAG & 0xfb0000) == 0)&&!((DETX,DETY) in BOX(10167,13005,3011,6575,0))' filtertype=expression rateset=mos1S001_LC_2.5-12.0.fits timecolumn=TIME timebinsize=1 maketimecolumn=yes makeratecolumn=yes withrateset=yes
corner
evselect table=mos1S001-ori.fits withfilteredset=yes expression='(PATTERN<=12)&&(PI in [2500:12000])&&(((FLAG & 0x766a0f63) == 0)||((FLAG & 0x766a0763) == 0))&&!((DETX,DETY) in BOX(13280,-306,6610,6599,0))&&!((DETX,DETY) in BOX(-13169,-105,6599,6599,0))&&((FLAG & 0x766a0f63) == 0)&&!(((DETX,DETY) in CIRCLE(100,-200,17700))||((DETX,DETY) in CIRCLE(834,135,17100))||((DETX,DETY) in CIRCLE(770,-803,17100))||((DETX,DETY) in BOX(-20,-17000,6500,500,0))||((DETX,DETY) in BOX(5880,-20500,7500,1500,10))||((DETX,DETY) in BOX(-5920,-20500,7500,1500,350))||((DETX,DETY) in BOX(-20,-20000,5500,500,0)))' filtertype=expression rateset=mos1S001_LC_corn_2.5-12.0.fits timecolumn=TIME timebinsize=1 maketimecolumn=yes makeratecolumn=yes withrateset=yes
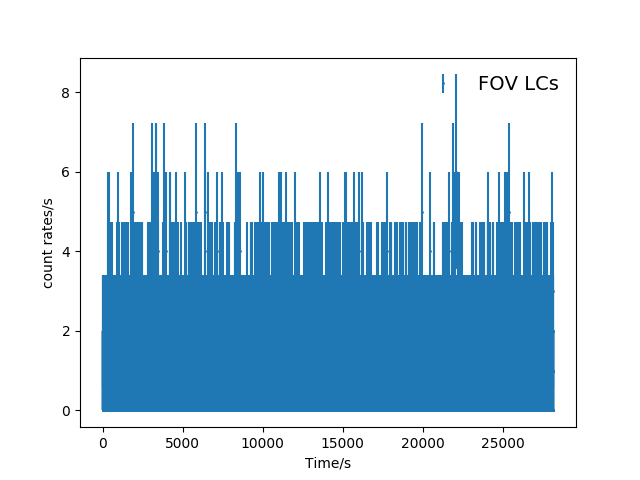
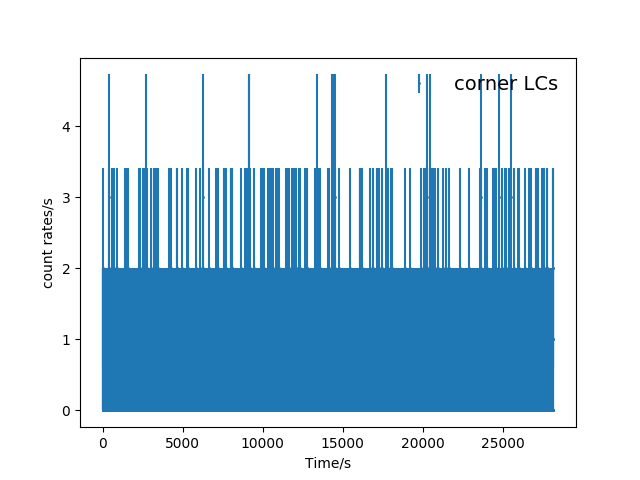
Here are the unbinned lightcurves.
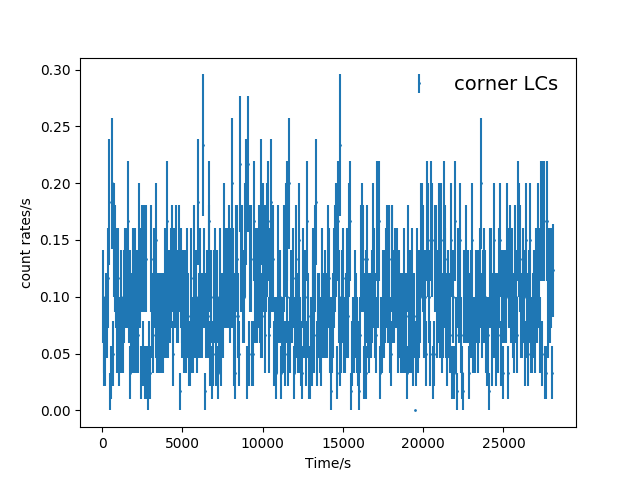
Fig. 2 The unbinned FOV(top panel) and corner(bottom panel) light curves (mos1S001-LC-2.5-12.0.fits and mos1S001-LC-corn-2.5-12.0.fits).
2) Bin the lightcurves, the default is 60s.
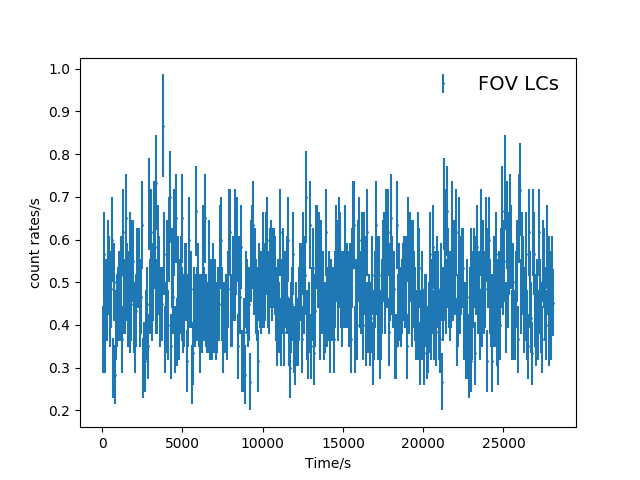
Here are the lightcurves binned in 60s.
Fig. 2 The binned(60s) FOV(top panel) and corner(bottom panel) light curves (mos1S001-LC-2.5-12.0.fits and mos1S001-LC-corn-2.5-12.0.fits).
3 and 4: Plot a histogram to see the distribution of count rates per second, then make a gaussian fit. Set criteria for filter, e.g. within 2σ of the best fit. Finally write the results in a text file and a fits file containing the good time interval fulfilling the selection criteria called mos1S001-gti.txt and mos1S001-gti.fits, respectively.
From the binned FOV LCs, a histogram is plotted and a gaussian fit is made within the fitting range (mos1S001_2.5_12.0_gti_ED.png). I set the fitting range to be the [highest histogrambin/1.4,highest histogrambin*1.4]. In
espfilt
(SAS command), it is decided by “rangescale”, but I don't know the exact algorithm. As for the selection criteria, I set it to be 2σ.
Here is the histogram, FOV LCs and corner LCs with selection indicated from this program .
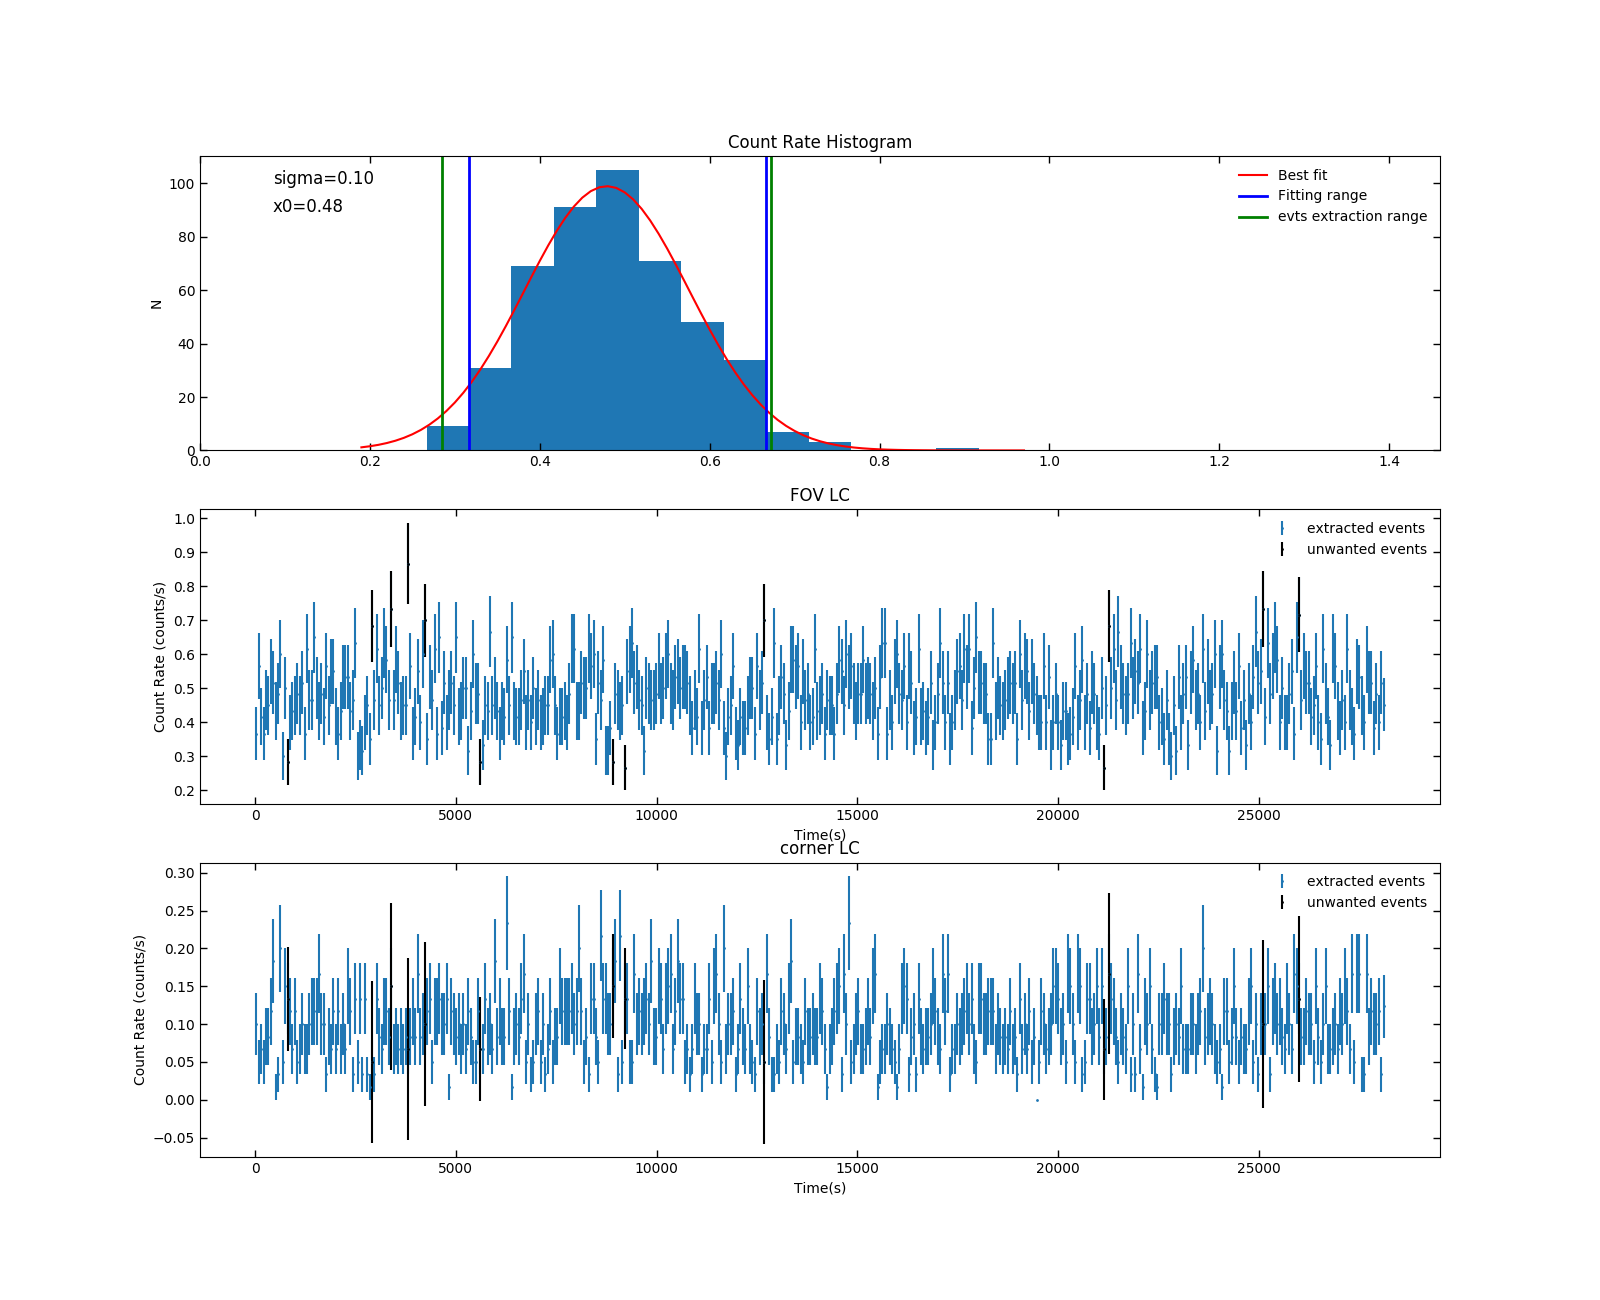 Fig 3. mos1S001_2.5_12.0_gti_ED.png. In the first panel, the blue boundary indicates the fitting range.The range is set to cut the high counts at the high end due to soft proton flares (they don’t always appear, of course). Within the green boundary are those events wanted. For the second and third panel, those unwanted events are indicated in black
5. From Fig 3. mos1S001_gti_ED.txt is produced. It is the good time interval files containing the filtered event times. If you compare this with the product from ESAS – mos1S001-gti.txt, you find some difference. This probably comes from the different binning of the histogram, different fitting range and different selection significance. To create the final filtered event list, i.e. mos1S001-clean.fits, you need to convert mos1S001_gti_ED.txt to fits format:
ftcreate colname.lis mos1S001_gti_ED.txt mos1S001_gti_ED.fits extname = "STDGTI" clobber=yes
(Ref:
https://heasarc.gsfc.nasa.gov/lheasoft/ftools/headas/ftcreate.html
)
colname.lis contains information of the column name, which has to be created in advance. It is just the following;
START D s
STOP D s
Now the fits good time interval is called mos1S001_gti_ED.fits
6.Finally, to produce the final product - mosS001_clean_ED.fits, we use the following command, with the good time interval file as a selection criteria:
evselect table=mos1S001-ori.fits filteredset=mos1S001_clean_ED.fits expression='(PATTERN<=12)&&
GTI(mos1S001_gti_ED.fits,TIME)
&&(((FLAG & 0x766a0f63)==0)||((FLAG & 0x766a0763) == 0))' filtertype=expression
